Tackle the hybrid workplace using powerful and easy to use space planning and reporting tools!
Through a clear understanding of how your space is truly used, learn to Reduce Occupancy Costs by Ensuring Optimal Space Utilization.
CADapultFM software solution equips you to improve space optimization, reduce occupancy costs, and forecast future space needs.
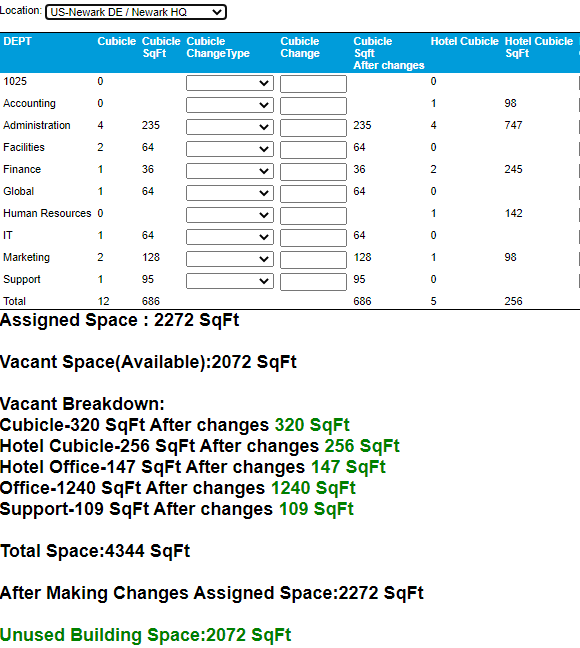
Space Forecasting Tools allow you to look at current Departmental Square Footage and relate space type use and easily forecast future space needs by easily
entering in a percentage or number of spaces to unerstand the resulting increased or decreased departmental square footage
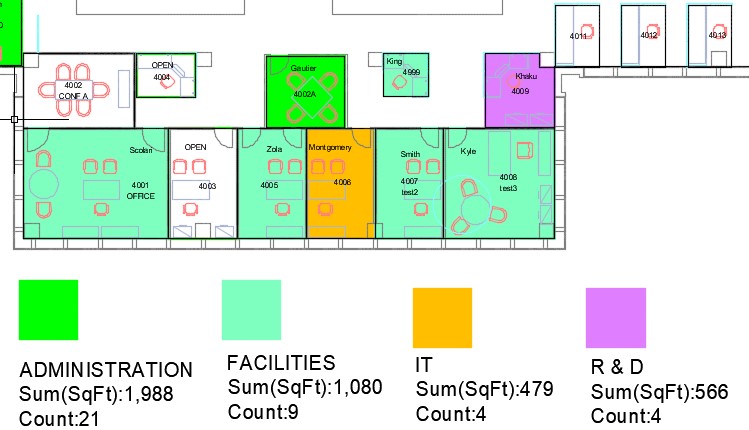
You can optimize space use by consolidating staff and organize departments more efficiently.
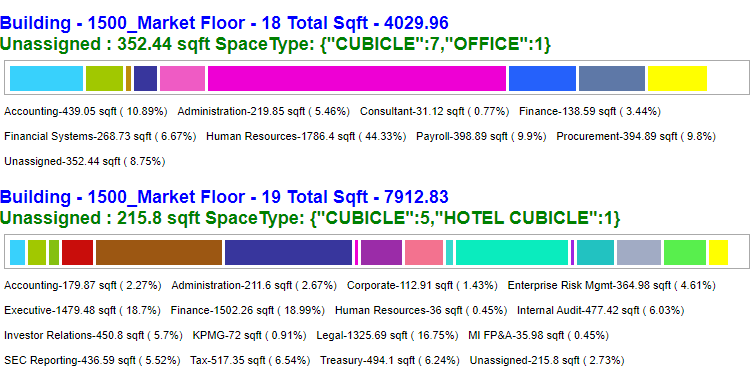
Drag and Drop Department Stacking Scenarios allow you to use Existing or Forecasted Data to organize an consolidate Department at a floor level
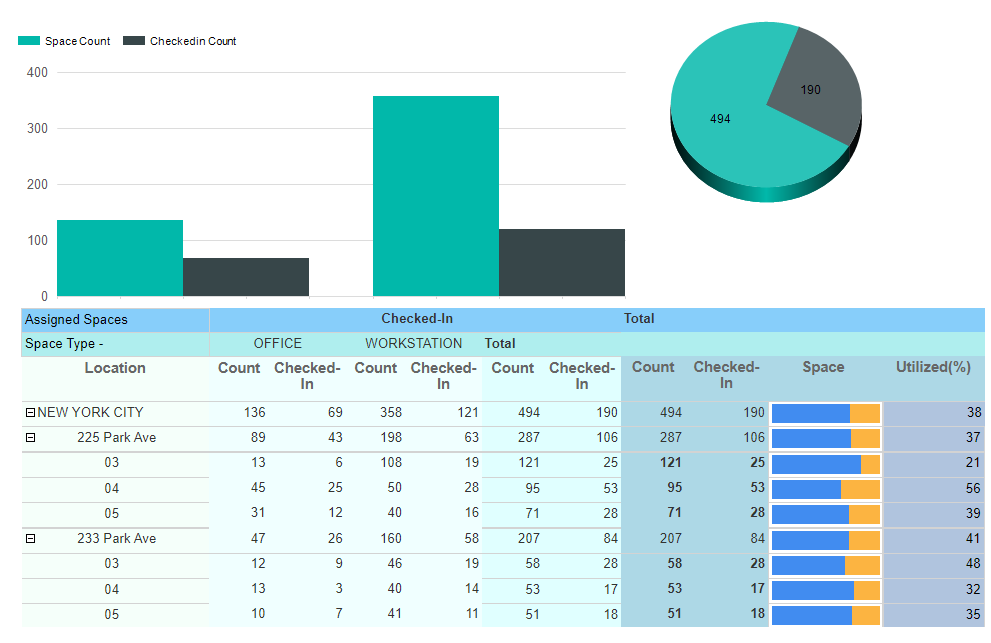
Numerous Data Driven Reports, both Graphic as well text with pie charts and bar graphs are readily available and built into the system. Many reports provide analytics with comparisons of information to help you better understand your space and personnel utilization and better plan for the future. In addition, the built in Dynamic Reporter provides all the necessary tables and data fields that have been configured with your specific system to allow you to create your own custom reports if necessary.